04 May 2024
If you’re in multiple Slack workspaces, you know it can get distracting to see unread message notifications. Slackoff is a tool to help you automatically sign out of Slack workspaces (on macOS) to improve focus. This guide will show you how to connect Slack to a Stream Deck to toggle workspaces with the push of a button.
Slackoff
Installation
Slackoff is easiest to install with pipx, a tool to run Python applications in isolated environments. To install that on macOS:
Add this line to your shell config (e.g. ~/.zshrc):
export PATH="${HOME}/.local/bin:${PATH}"
Then in a new terminal window you should be able to install Slackoff:
$ pipx install slackoff
$ slackoff --version
Usage
To test that it’s working, try toggling one of your Slack workspaces:
$ slackoff --signout My Company Workspace
$ slackoff --signin My Company Workspace
where “My Company Workspace” is the name of one of your Slack workspaces. You may need to grand accessibility permissions to your terminal application.
Slackoff will also remember the last used workspace so you can toggle it with a single command:
Stream Deck
Setup
To call Slackoff from a Stream Deck action, we first need to create a wrapper script. Open the Script Editor application on macOS and paste the following:
do shell script "/Users/Browning/.local/bin/slackoff"
where “Browning” is your user name. Save that file somewhere that Stream Deck can find it.
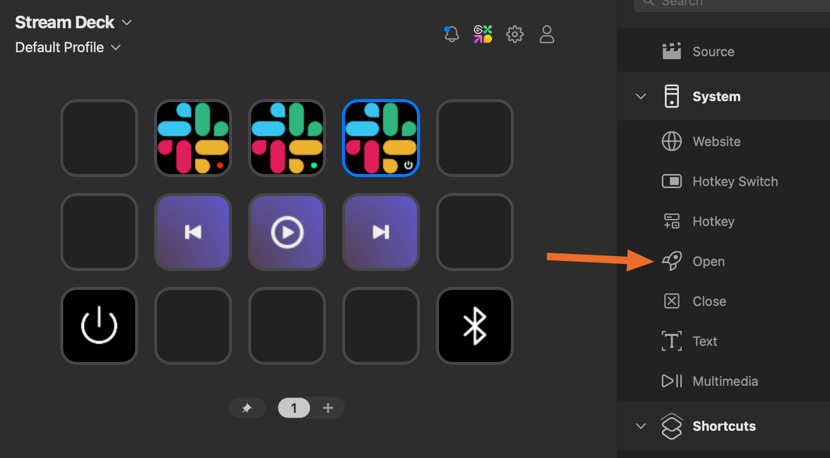
Next, add the System > Open action to a button:
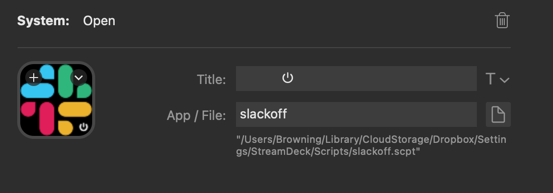
Then, configure that action to call the AppleScript you created:
Usage
At the start and end of each day, simply press that Stream Deck button to toggle Slack workspaces. Enjoy your improved work-life balance! 🎉
See a typo? Help me edit this post.
22 Mar 2017
Heroku is a great platform to deploy your full-stack application. While not the appropriate place to deploy a production frontend application, Heroku’s Review Apps offer an automated mechanism to create a temporary deployment of your application to a unique, predictable URL.
Review Apps
After creating a Heroku account, create a “Pipeline” for your project and connect it to a repository on GitHub. Heroku’s Pipelines allow your application code to be deployed multiple times, from different branches.
Regardless of the technology your application uses, you will need to tell Heroku about your application’s dependencies in a manifest file. The most basic app.json will look similar to the following:
{
  "name": "grwifi",
  "scripts": {},
  "env": {},
  "formation": {},
  "addons": [],
  "buildpacks": []
}
Web Server
In order to serve up our static site, we’ll need to run a web server on Heroku. I developed sappy specifically for the purpose of serving up single-page applications (SPAs) and static websites.
To run our application on Heroku using Sappy, we’ll need to add a few files:
runtime.txt indicates that Heroku should use a Python buildpack (because Sappy is written in Python):
requrements.txt tells Heroku to install Sappy using pip (the package manager for Python):
Procfile specifies sappy as the command to run our application:
web: sappy --port=${PORT}
Automated Deployment
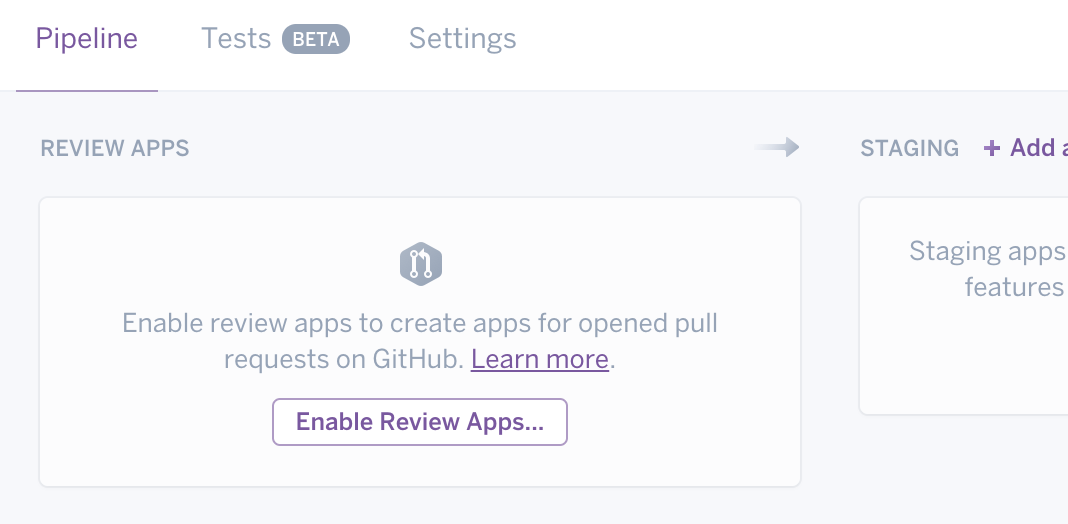
After adding the above files to your repository, enable Review Apps on the pipeline we created earlier:
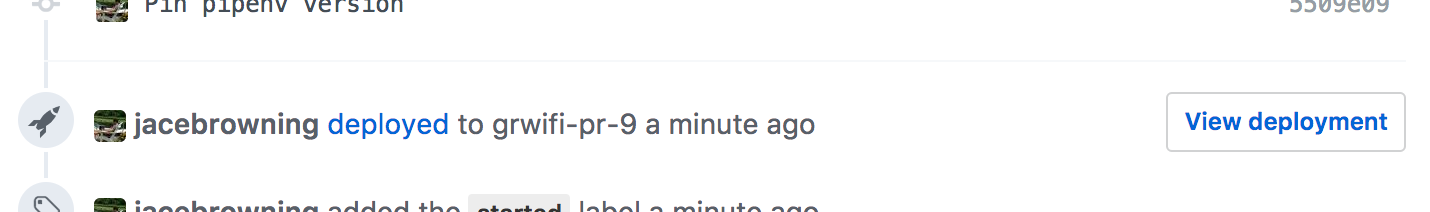
When new pull requests are created on GitHub, Heroku will automatically deploy the code in that branch to a separate Heroku instance:
Because the temporary application deployment performs virtually identical to production, the end-to-end testing and design review that might occur later in our quality assurance process can now be performed before the code is even merged.
A working example can be found at: github.com/citizenlabsgr/homepage
See a typo? Help me edit this post.
21 Oct 2016
When I was searching for my last job, I found it useful to make a list of all the things I was looking for in a new career. As it turned out, there were actually two categories within these requirements. Upon making a list, I found that I both cared about the company I worked for and the job at hand.
I encourage everyone to make similar lists as a way to learn about your true career goals. You might be surprised that you want something different than you have. I will attempt to maintain these lists as my perspective changes, but here they are.
Company Requirements
-
Work on new products with friends
-
Build tools for software engineers
- Work in an industry that strongly interests me:
- politics
- music
- theme parks
-
Work at “a Python shop”
- Consult teams and companies on:
- Automation
- Quality Assurance
- Testing
- Agile Methodologies
- DevOps
- Get paid to work on open source software
Job Requirements
-
Feel like at least half of the team cares more than I do
-
Flexible working hours and support for asynchronous work
-
Work on a team that hates bugs and insists on prioritizing bugs first
-
Have some free work time for side projects
-
Have a dedicated conference budget
See a typo? Help me edit this post.
30 Sep 2016
Measuring coverage is an important, but sometimes forgotten part of running tests. One of the common debates is around how much coverage a project should have: 50%, 80%, 100%?
More important than the actual coverage metrics is ensuring that your coverage metrics don’t decrease when adding new code. Coverage metrics don’t tell us when a particular section of code has enough tests, but they do help inform us when a section of code has zero tests.
Tracking Metrics
A few options exist for tracking coverage metrics.
Version Control
The naive solution is to commit coverage metrics to a file in your project repository. When tests are run, check this file and report an error if coverage decreased. The main disadvantage of this approach is having lots of commits unrelated to functional changes, which adds noise to your repository.
External Services
Many external services exist to track coverage metrics. One such example is Coveralls. This service works great and is highly recommended for open-source projects to track coverage on pull requests. The main disadvantages of this service are the costs for private repositories and the inability to check coverage metrics locally.
The Coverage Space
coverage.space is a new RESTful API to track coverage metrics that aims to find a balance between these two options.
Basic Usage
The easiest way to get started with The Coverage Space is to use an HTTP client. HTTPie works well for this:
Update metrics for your project:
$ http PUT api.coverage.space/my_owner/my_repo unit=90
where my_owner/my_repo matches your project.
Check out the full API documentation at coverage.space/api.
Command-line Client
A command-line client is also available to automate the process of reading and uploading coverage metrics:
$ pip install --update coverage.space
After running your tests with coverage enabled, update metrics for your project:
$ coverage.space my_owner/my_repo unit
where my_owner/my_repo matches your project.
Check out the full client documentation at cli.coverage.space.
See a typo? Help me edit this post.
Interested in seeing the full implementation? Check out the code on GitHub.
24 Jan 2016
memegen.link is an open source meme generator. It renders meme images based on the requested URL.
For example, memegen.link/oprah/you-get-a-meme/and-you-get-a-meme.jpg produces this image:

The site also provides an API to generate memes. This article is about the legacy implementation written using Flask and Flask API.
Client-side Analytics
I have added Google Analytics to the index and API documentation pages using the standard approach of embedding JavaScript on the page:
...
<body>

  <script>
    ... '//www.google-analytics.com/analytics.js','ga');
    ga('create', '<Google Analytics ID>', 'auto');
    ga('send', 'pageview');
  </script>

</body>
...
And while this works great for HTML rendered in the browser, direct images requests (like the meme image above) go untracked.
Server-side Analytics
One solution is to track file downloads on the backend by posting to the Google Analytics API directly using an HTTP library like requests:
logging.info("Sending image: %s", path)

data = dict(
    v=1,
    tid='<Google Analytics ID>',
    cid=request.remote_addr,

    t='pageview',
    dh='memegen.link',
    dp=request.path,
    dt=title,

    uip=request.remote_addr,
    ua=request.user_agent.string,
    dr=request.referrer,
)
requests.post("https://www.google-analytics.com/collect", data=data)

return send_file(path)
While this will track page views for an image, much of the client’s information is still unavailable using this method:
- geographic location
- language setting
- device properties
Tricking Clients
My complete solution involves a bit of hack to return HTML instead of an image for clients that can handle it and the normal image for those that can’t.
Visit memegen.link/fry/not-sure-if-image/or-webpage.jpg in your browser:
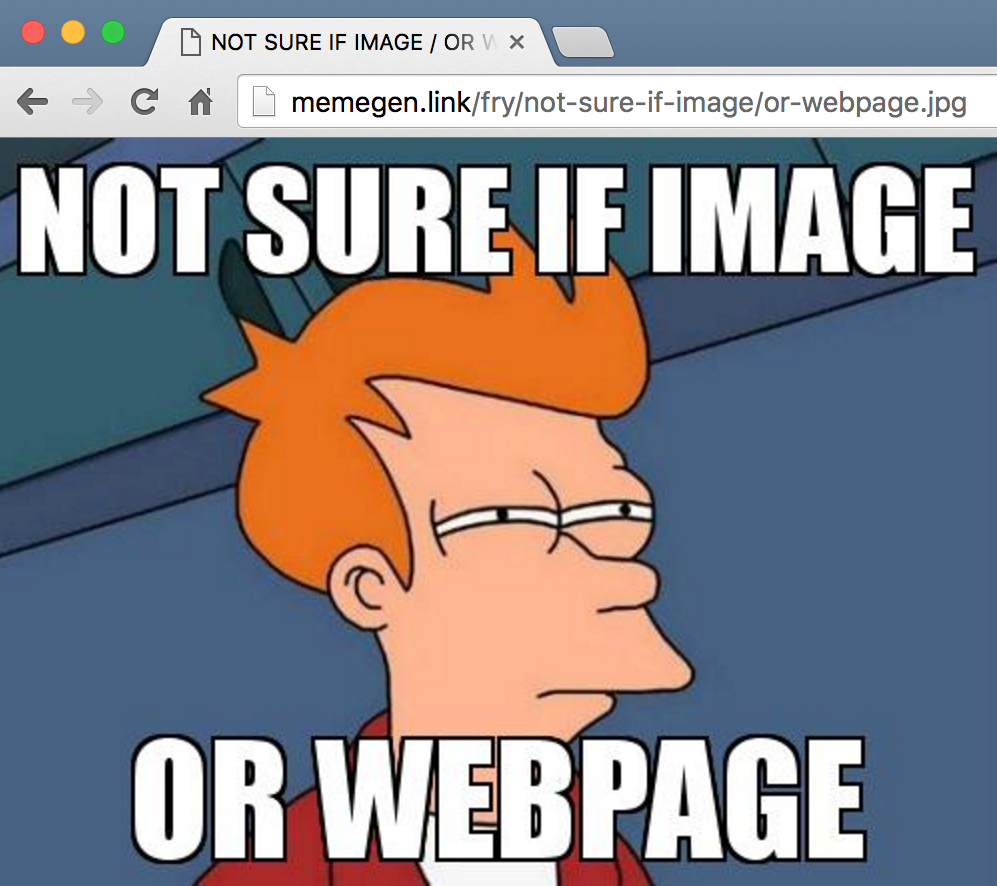
It appears to be an image that can be downloaded:
$ wget https://memegen.link/fry/not-sure-if-image/or-webpage.jpg
Length: 27809 (27K) [image/jpeg]
Saving to: 'or-webpage.jpg'
or-webpage.jpg 100%[============================>]  27.16K  70.7KB/s
2016-01-24 20:51:46 (70.7 KB/s) - 'or-webpage.jpg' saved [27809/27809]
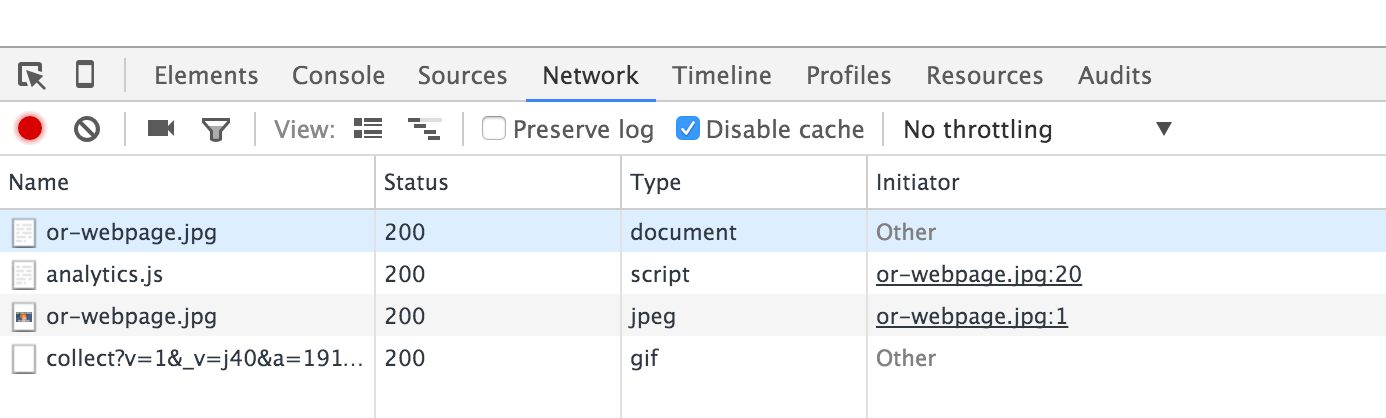
But if you view the network tab in Chrome’s developer tools, you’ll see that it actually loaded a small webpage to run the same client-side Google Analytics JavaScript as above:
This was accomplished by detecting what content types the client can accept:
mimetypes = request.headers.get('Accept', "").split(',')

if 'text/html' in mimetypes:
    send_html()
else:
    send_image()
If the client can handle HTML, the following is returned:
<!DOCTYPE html>
<html>
<head>

  <title>NOT SURE IF IMAGE / OR WEBPAGE</title>

  <style>
    body {
      background-image: url("/fry/not-sure-if-image/or-webpage.jpg");
      background-repeat: no-repeat;
    }
  </style>

</head>
<body>

  <script>
    ...
    ga('create', '<Google Analytics ID>', 'auto');
    ga('send', 'pageview');
  </script>

</body>
</html>
This causes the browser to render the image as expected, but also run a bit of JavaScript to recored additional information about the client.
See a typo? Help me edit this post.
Interested in seeing the full implementation? Check out the code on GitHub.